
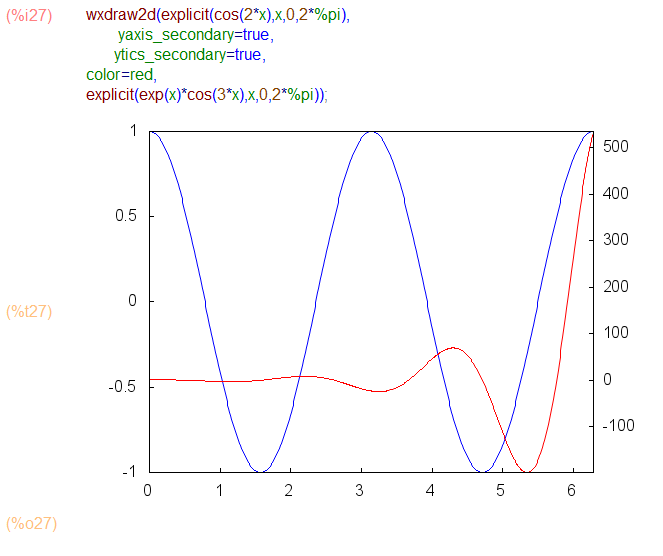
In MATLAB, I occasionally have need for the plotyy() command for making a plot of two different functions with widely varying scales.
Turns out Maxima draw has an equivalent functionality by setting the option yaxis_secondary:

In MATLAB, I occasionally have need for the plotyy() command for making a plot of two different functions with widely varying scales.
Turns out Maxima draw has an equivalent functionality by setting the option yaxis_secondary:
