

In MATLAB, I often use the subplot() command to make an array of multiple plots in a single figure.
In Maxima, we can achieve that by generating each of the subplots using gr2d(), and then putting them all together with a call to draw() or wxdraw():

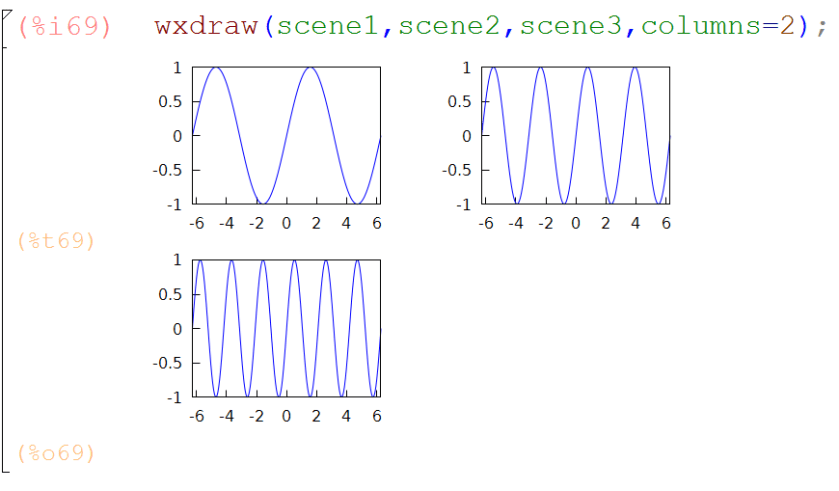
There’s an optional columns argument — the subplots are drawn row-wise in an array with the specified number of columns:
And of course all this works for 3d plots using gr3d():


One thought on “Multiple plots in a single Maxima figure”