Legend Position in Maxima Plots

Here’s something I just learned and want to share with others and record for my use the next time I need to do this and have already forgotten!

The position and appearance of the figure legend in Maxima plots drawn with plot() (by setting gnuplot_preamble) and in draw() (by setting user_preamble),  can be manipulated to any of the gnuplot options listed here.

Here are some examples:

plot_legend0

plot_legendtopleft

draw_legendatbox

Advertisement

A pause() function for Maxima

In MATLAB, pause interrupts execution of a loop until the user strikes a key, and pause(<n>) pauses for <n> seconds before resuming execution.
Here’s my attempt at a pause() function for Maxima that works in a similar way to MATLAB.  It uses Maxima’s read() to stop everything and wait for user input, and it uses the lisp function sleep to stop for a fixed number of seconds.
**note that a lisp function
     (function-name argument)
can be called inside Maxima as
     ?function-name(argument)
I’m not happy that in order to resume after the pause, the user needs to enter a valid character (space or nothing results in an error) followed by CTRL-SHIFT.  I hope to either figure something else out or even better hear suggestions from other Maxima users!
pause([options]):=block([tsecs],
    tsecs:assoc('pausetime,options,0),
    if tsecs=0 then
       read("Execution Paused...enter any character then CTRL-ENTER")
    else(
        disp(sconcat("paused for ", tsecs," seconds")),
       ?sleep(tsecs)),
    return("")
);
call this either as
     pause();
or, for a three second pause
     pause(pausetime=3);

Multiple plots in a single Maxima figure

In MATLAB, I often use the subplot() command to make an array of multiple plots in a single figure.

In Maxima, we can achieve that by generating each of the subplots using gr2d(),  and then putting them all together with a call to draw() or wxdraw():

2scenes

There’s an optional columns argument — the subplots are drawn row-wise in an array with the specified number of columns:

3scenes

And of course all this works for 3d plots using gr3d():

3dscenes

Maxima Language Syntax Highlighting in Notepad++

notepad_plus_plus

Notepad++ is lots of people’s favorite text editor for Windows.  I use it every day.

A little googling around led me to a Notepad++ user-defined syntax highlighting  file for the Maxima language, written by David Scherfgen and shared at the Maxima-Discuss list.

I made a little change to the file that overcame a nagging difficulty —  I found that .mac file extensions weren’t automatically being recognized upon opening.

Here’s a link to my modifed file.

To include Maxima syntax highlighting in Notepad++ do this:

  1. unzip the downloaded file MaximaNotepadDS.zip
  2. in Notepad++, go to Language –> Define your language…
  3. Press Import and navigate to the file MaximaNotepadDS.xml
  4. Quit Notepad++ and then start the program again.
  5. Now in Language menu, you’ll see Maxima in the list of languages at the bottom of the drop-down menu
  6. A  .mac file already open won’t display with the new syntax highlighting, but any .mac file you open or save from new will automatically show with syntax highlighting.

Popularity of CAS software: Maxima, Mathematica, Maple

I was looking recently at the PYPL PopularitY of Programming Language.

That site ranks popularity of programming languages (Java is #1)  using Google Trends tools based on searches of the form <Language Name> Tutorial.  I did my own Google Trend search, comparing the 3M of Computer Algebra Systems:  Maple, Mathematica, and Maxima using the Tutorial criteria as at PYPL.

With the data from Google Trends, I computed the proportion of the total 3M monthly searches for each program.  Here’s how that looks over time since 2004:

3Mproportions

It appears to me that Maxima is slowly and steadily gaining with nearly 20% share, Maple is currently at about 30%, and Mathematica at 50%.  Does anybody know what happened between 2006 and 2013 to account for the increase in popularity of Mathematica and decrease for Maple?

A Package of Maxima Utilities for my Ordinary Differential Equations Course: MATH280.mac


I’ve put together a collection of functions — some direct quotes of other contributed functions, some renamed or repackaged, and some newly implemented — for various needed tasks in my undergraduate ordinary differential equations course.

I’ve written elsewhere about the Backward Difference Formula implementations, the phase space visualization functions,  the matrix extractors, and  the numerical solutions plotters.

The package includes my home-grown help utility.

You can download the package MATH280.mac

…and if you’re interested, here’s my multivariable calculus package MATH214.mac

MATH280.mac contains:
 wxphaseplot2d(s)
 wxphaseplot3d(s)
 phaseplot3d(s)
 wxtimeplot(s)
 plotdf(rhs)
 wxdrawdf(rhs)
 sol_points(numsol,nth,mth)
 rkf45(oderhs,yvar,y0,t_interval)
 BDF2(oderhs,yvar,y0,t_interval)
 BDF2a(oderhs,yvar,y0,t_interval)
 odesolve(eqn,depvar,indvar)
 ic1(sol,xeqn,yeqn)
 ic2(sol,xeqn,yeqn,dyeqn)
 eigU(z)
 eigdiag(z)
 clear()
 -
 -
 for any of the above functions,
 help(function_name) returns help lines for function_name
 -
 Last Modified 5:00 PM 3/27/2017

Jordan Canonical Form in Maxima

After not easily finding such a thing from a cursory search of the Maxima documentation, I spent a few hours over the weekend beginning to write a Maxima function to compute, for any given square matrix M , an invertible matrix P so that

P^{-1}MP = J

where J is the Jordan matrix that displays the eigenvalue/vector structure of M.

It took several searches for me to find, but of course there’s already such a  function — with a not so easily searched-for name — in the diag package:   ModeMatrix()


ModeMatrix

To see just the matrix J
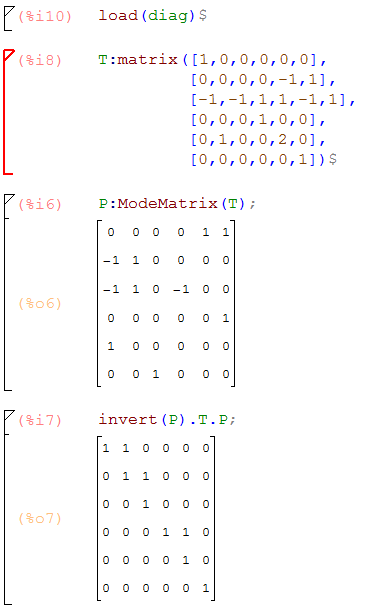
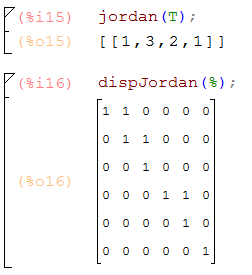
, diag provides jordan() and dispJordan()

dispJordan